The Engagement tab shows what visitors actually do on a published landing page: what they click, how far they scroll, and where they spend their time. Use it when a page gets traffic but not enough conversions and you need to know which part of the page is losing people. Engagement data is recorded per variant and per device, so you can compare a winning A/B test variant against a losing one, or check that a page that works on desktop also works on mobile.

How to open the Engagement tab

1

Go to Landing Pages

Open Landing Pages in the left sidebar and find the page you want to analyze.
2

Open the landing page

Click the landing page name to open its detail view.
3

Select the Engagement tab

Click Engagement, next to Overview in the tab row.
4

Pick a date range

Use the range selector on the right: 1D, 7D, 1M, 3M, All, or Custom. The range applies to every view in the tab.

Engagement tab selected on a landing page, with the Metrics, Clicks, Scroll Depth and Attention views below it
The tab opens on Metrics. Clicks, Scroll Depth and Attention draw their data on top of a live preview of the page.

Choose the variant and device

Variant selector, top right. Pick which variant you are looking at. Each entry shows its visitor count and engaged share for the selected date range, the Main badge marks the main variant, and a variant with no traffic in the range reads No visitors in this range.
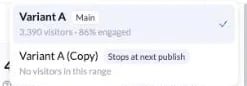
Variant selector listing the main variant with its visitor count and engaged percentage, and a second variant with no visitors in the range
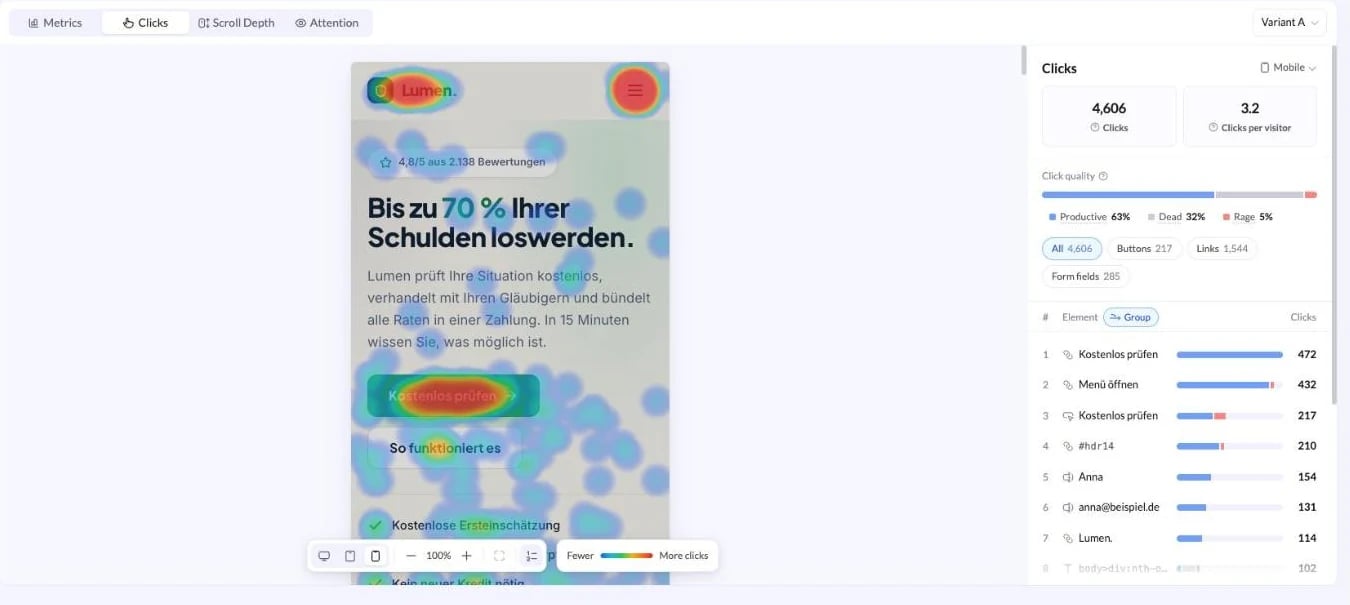
Device, top right of the data panel. Metrics always reports All devices and breaks the traffic down for you. Clicks, Scroll Depth and Attention show one device at a time, Desktop, Tablet or Mobile, because the page layout differs on each. Switching the device redraws the preview at that width and reloads the numbers for that device only, so the overlay always sits on the layout those visitors saw.
Click map for mobile visitors, with the page preview redrawn at mobile width and mobile only click totals in the panel
The view and the device are both stored in the page URL, so you can bookmark a specific heatmap or paste it to a teammate and they land on the same view.

Metrics

Metrics is the summary view. The header shows total visitors and unique visitors for the range, followed by six figures.
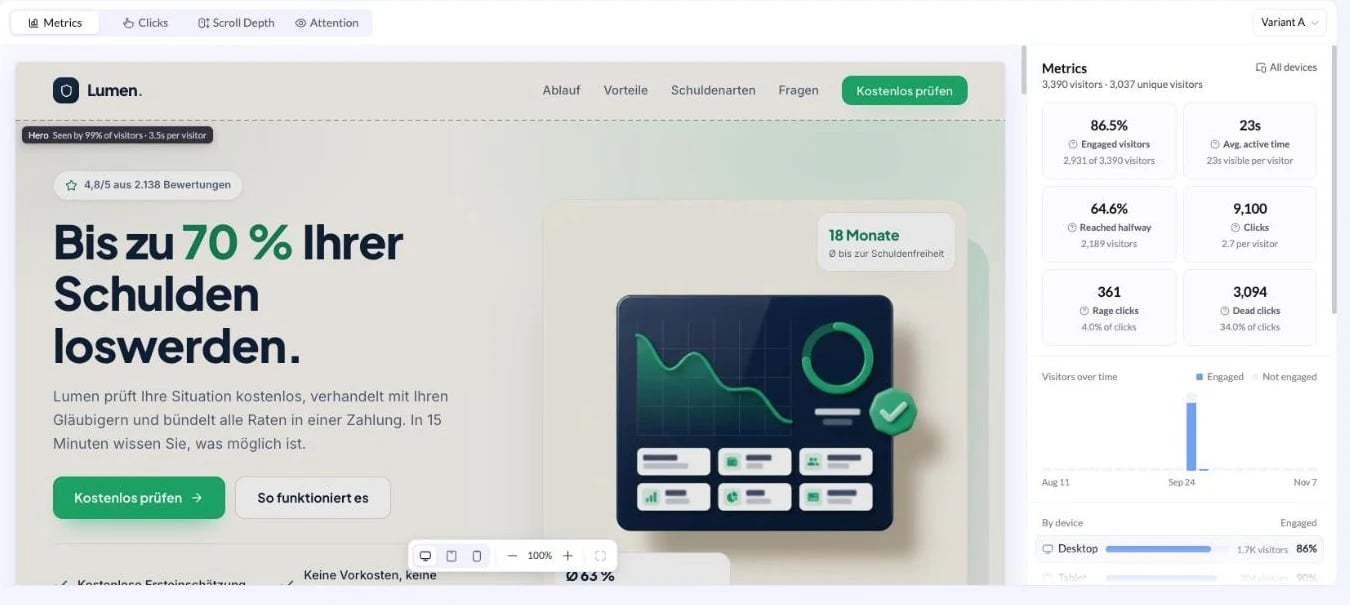
Metrics view showing engaged visitors, average active time, reached halfway, clicks, rage clicks and dead clicks next to a preview of the landing page
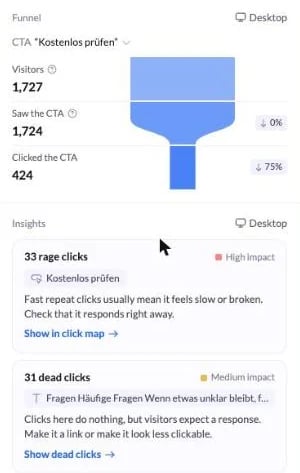
Below the figures the panel continues with three sections. Visitors over time plots engaged against not engaged visitors across the selected range, so you can see whether a drop in quality lines up with a traffic source or a page change. By device lists Desktop, Tablet and Mobile with the visitors on each and the engaged share of each. A device that trails the others by a wide margin is usually a layout problem, so open Clicks or Scroll Depth on that device to confirm. Funnel picks one call to action and counts the visitors who saw it and the visitors who clicked it, with the drop at each step. Use the CTA dropdown to switch between the calls to action on the page. Insights turns the numbers into specific problems. Each card names the element, grades the impact as High impact or Medium impact, explains what visitors are doing, and links straight to the view that proves it: Show in click map for rage clicks, Show dead clicks for clicks that go nowhere.
Funnel showing visitors, saw the CTA and clicked the CTA, above insight cards for rage clicks and dead clicks

Clicks

Clicks draws a click map over the page. Warm spots are the elements that get clicked most, cool spots get the least.
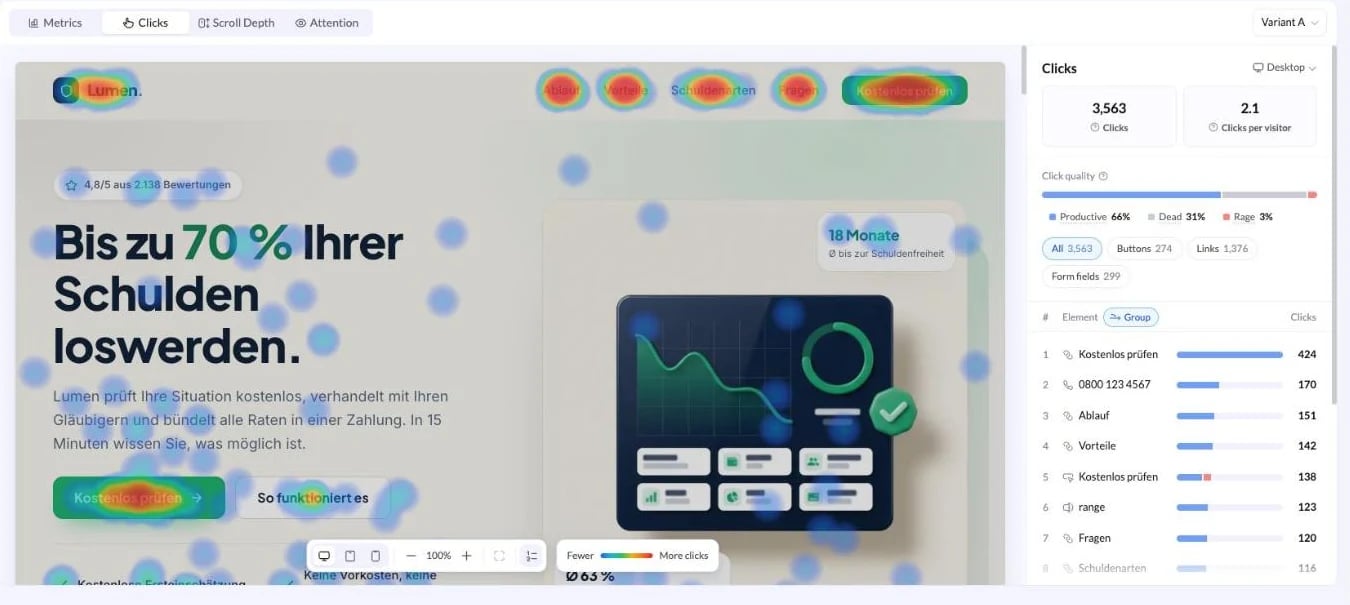
Click map over a landing page preview, with click quality, element filters and a ranked list of the most clicked elements
The panel on the right breaks the clicks down. Clicks and Clicks per visitor give the totals for the selected device. Click quality splits every click into Productive, Dead and Rage. A high dead share means visitors are clicking things that look interactive but are not, such as an image, an icon or a heading. Element filters narrow the map to All, Buttons, Links or Form fields, each with its own count. Ranked elements lists the most clicked elements in order, with the element type next to each one. Turn on Group to merge repeated elements, so three links that all read “Get started” count as one row. The button at the bottom of the list names the total and expands it, for example Show all 50 elements.
Use Show element ranks in the preview toolbar to put numbered badges on the page itself. The badges match the ranked list, which makes it easy to find a row that sits far down the page.

Scroll Depth

Scroll Depth shades the page from the top down and marks the depth lines across it: 25%, 50% and 75% of the page, each labelled with the share of visitors who got that far. A dashed line marks the average fold, the point where the page is cut off on first load.
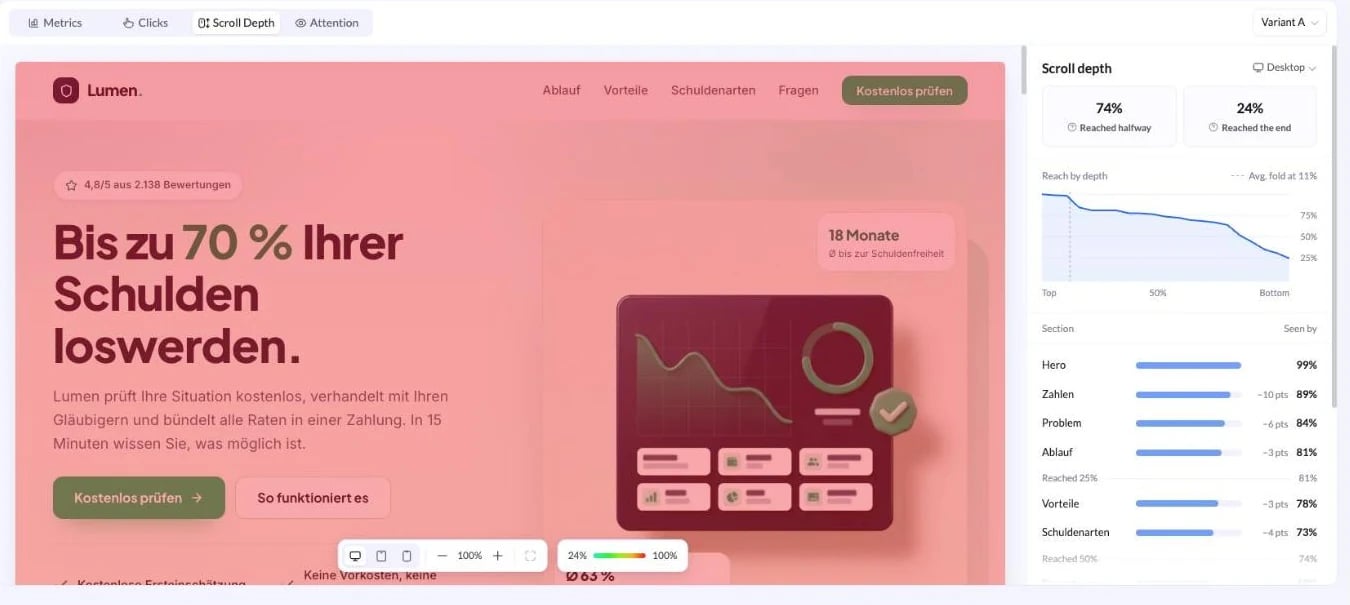
Scroll depth view with depth markers on the page preview and a section list showing the share of visitors who saw each section
Reached halfway and Reached the end are the headline numbers. Reach by depth charts how fast the audience thins out from top to bottom. The Section list is the useful part. It names every section of the page in order, gives the share of visitors who saw it, and shows the drop in percentage points against the section above it. The biggest drop is where you are losing people, so a call to action below that point is reaching a fraction of your traffic.

Attention

Attention colours the page by time spent instead of by clicks. Green sections hold attention briefly, red sections hold it longest. Each section carries a tag with its time and the share of visitors who saw it.
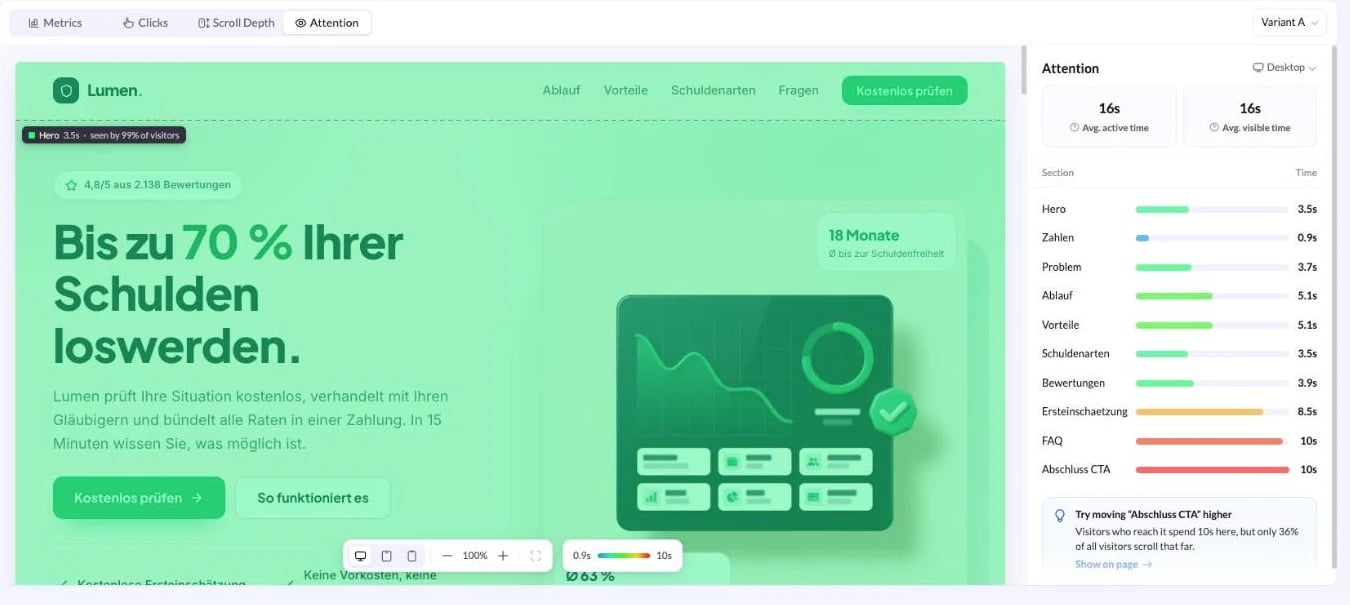
Attention view colouring each section of the landing page by time spent, with average active time and a per section time list
Avg. active time counts the time visitors spent using the page. Avg. visible time counts the time the page was open and in view. A large gap between the two means visitors left the tab open without reading. Read Attention together with Scroll Depth. A section with a long time but a low seen by share is content that works, placed too far down the page.
Long attention is not automatically good. A long time on a form or a pricing table can mean the content is confusing rather than compelling.

Controls on the page preview

The toolbar sits at the bottom of the preview in all three visual views.

Preview toolbar with desktop, tablet and mobile widths, zoom controls, fit to width, show element ranks, and the click map legend
Each of the three visual views ends with a suggestion card under the data, and its Show on page link scrolls the preview to the element it refers to.

When the Engagement tab is empty

If the tab reads No visitors in this range yet, the page had no recorded traffic in the selected range. Click Show the period with traffic to jump to a range that has data, or widen the range to All. Check these before assuming the data is missing:
Engagement is recorded from visits to the published page. A draft that has never been published has nothing to report.
Each variant collects its own data. A variant that was just added, or one that receives a small share of the traffic split, can be empty while the main variant is not.
Clicks, Scroll Depth and Attention show one device at a time. Check By device on the Metrics view to see which devices actually have traffic.
The overlay is drawn on the current version of the page. If sections were added, removed or reordered since, compare against a date range that matches the current layout.