

Open the quiz analytics
Open the landing page
Go to Landing Pages in the left sidebar and open the page whose quiz you want to review.
Go to the Overview tab
The Overview tab is selected by default. Scroll down to the Variants section.
Find the variant
Each variant has a quiz panel beneath it. If your page has one variant, that’s the main one (marked MAIN); with multiple variants, each has its own quiz stats.
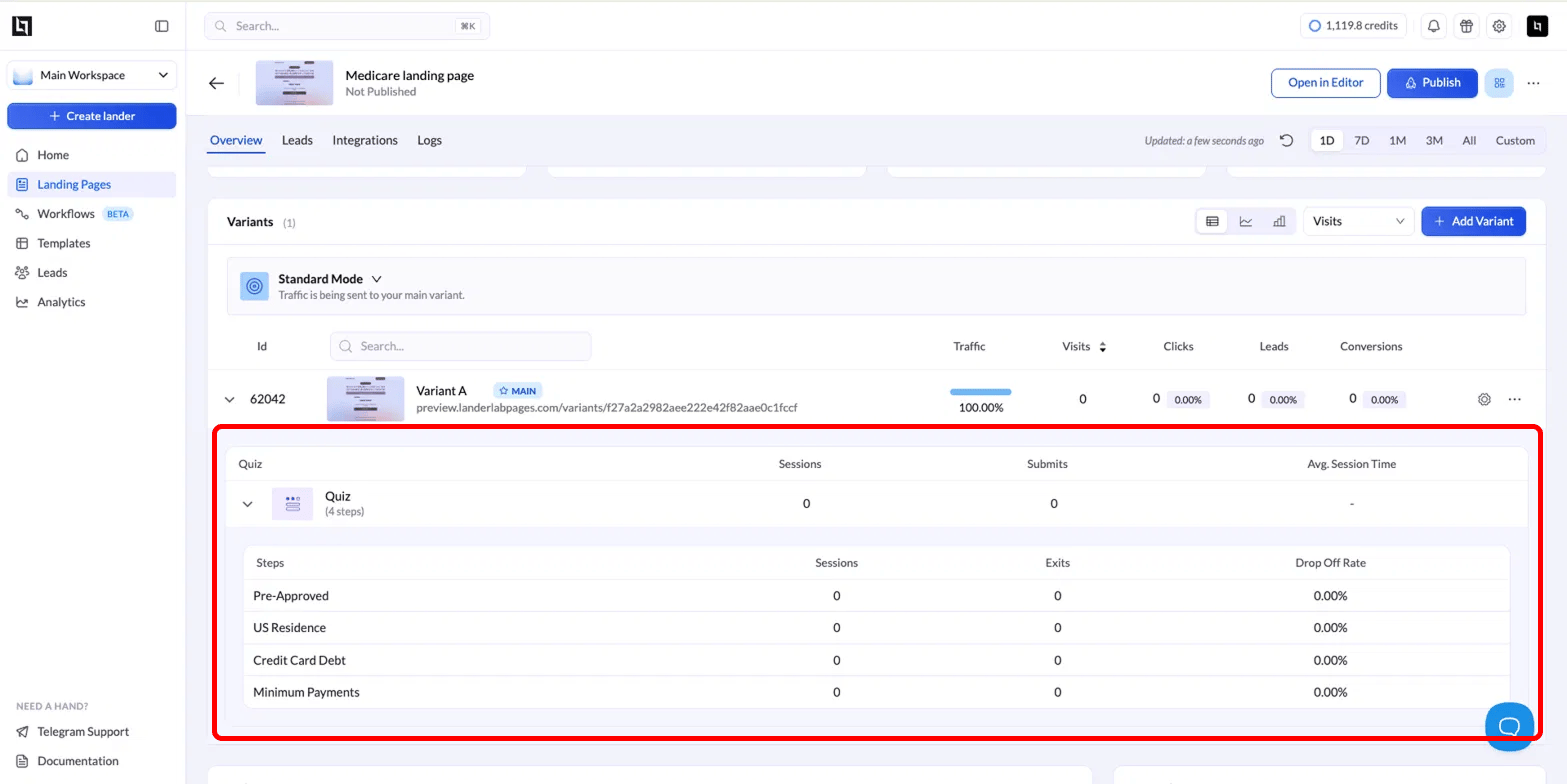
Read the quiz summary
The Quiz row gives you the high-level picture for the variant. It also shows how many steps the quiz has (for example, Quiz (4 steps)).| Metric | What it tells you |
|---|---|
| Sessions | How many times the quiz was started. |
| Submits | How many visitors completed and submitted the quiz. |
| Avg. Session Time | The average time visitors spent in the quiz. |
Read the step-by-step drop-offs
Expanding the Quiz panel reveals a row for each step of the quiz, listed in the order visitors see them.| Column | What it tells you |
|---|---|
| Steps | The name of each quiz step (for example, Pre-Approved, US Residence). |
| Sessions | How many visitors reached that step. |
| Exits | How many visitors left on that step instead of continuing. |
| Drop Off Rate | The share of that step’s sessions that exited there. |
Change the date range
Use the range selector at the top right of the Overview — 1D, 7D, 1M, 3M, All, or Custom — to scope the quiz numbers to a specific period. The figures update to match the selected range.Quiz data appears only for landing pages that include a quiz, and the numbers populate as visitors interact with the page. A page with no traffic yet shows zeros across every step.