

Where to Find Logs
Go to Settings and click Logs in the left sidebar. The page displays all events across your organization in reverse chronological order.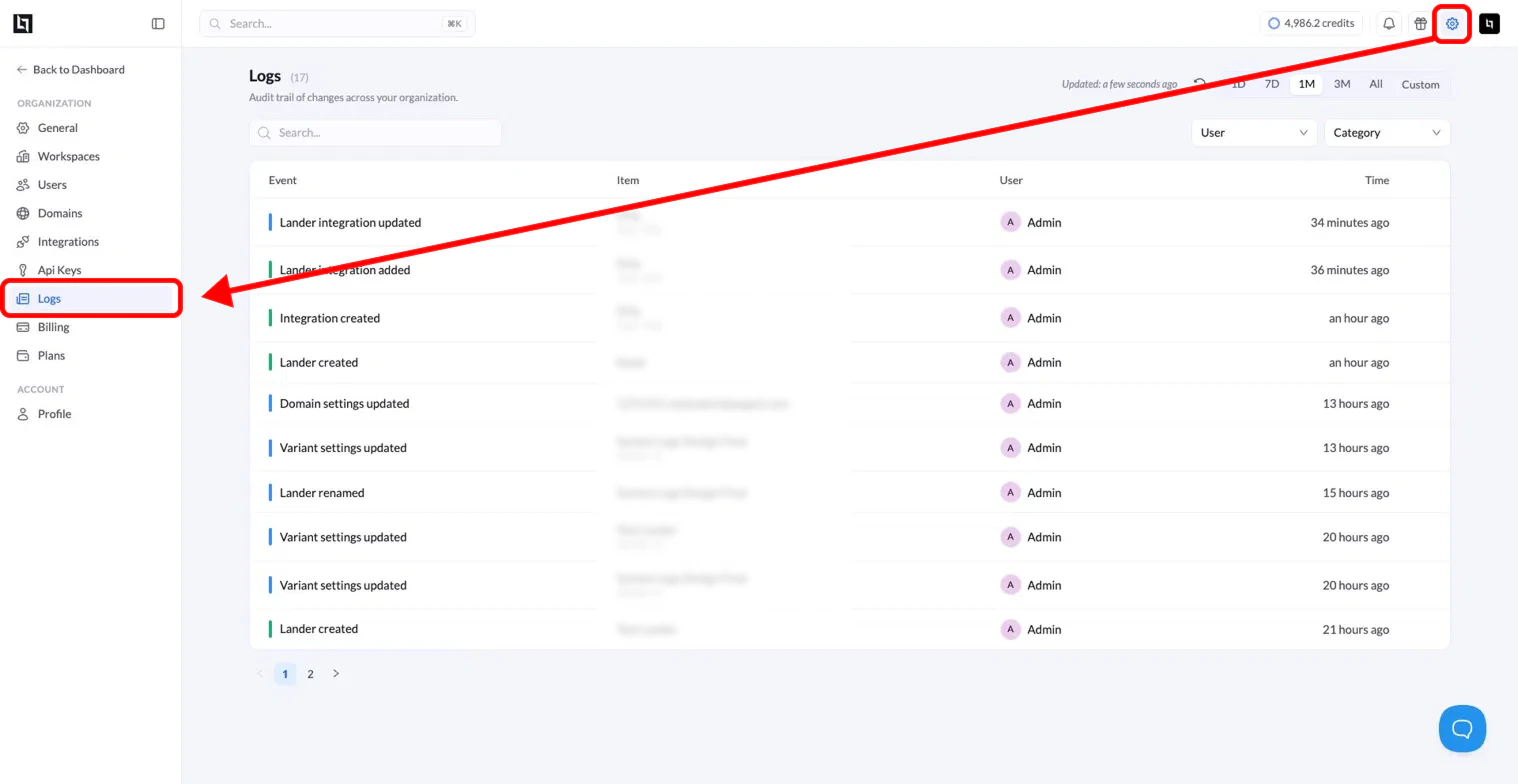
Reading the Log Table
Each row in the log table represents a single event and shows four columns:
A colored bar on the left edge of each row provides a quick visual indicator for the event type.
Filtering Logs
You can narrow the log view using the controls at the top of the page:- Date range: Choose from 1D, 7D, 1M, 3M, All, or Custom to limit results to a specific time window.
- User: Filter by a specific team member to see only their activity.
- Category: Filter by event category to focus on a particular type of action.
- Search: Use the search bar to find events by keyword.
Viewing Event Details
Click any row to open the event detail panel. This panel shows a full breakdown of the event: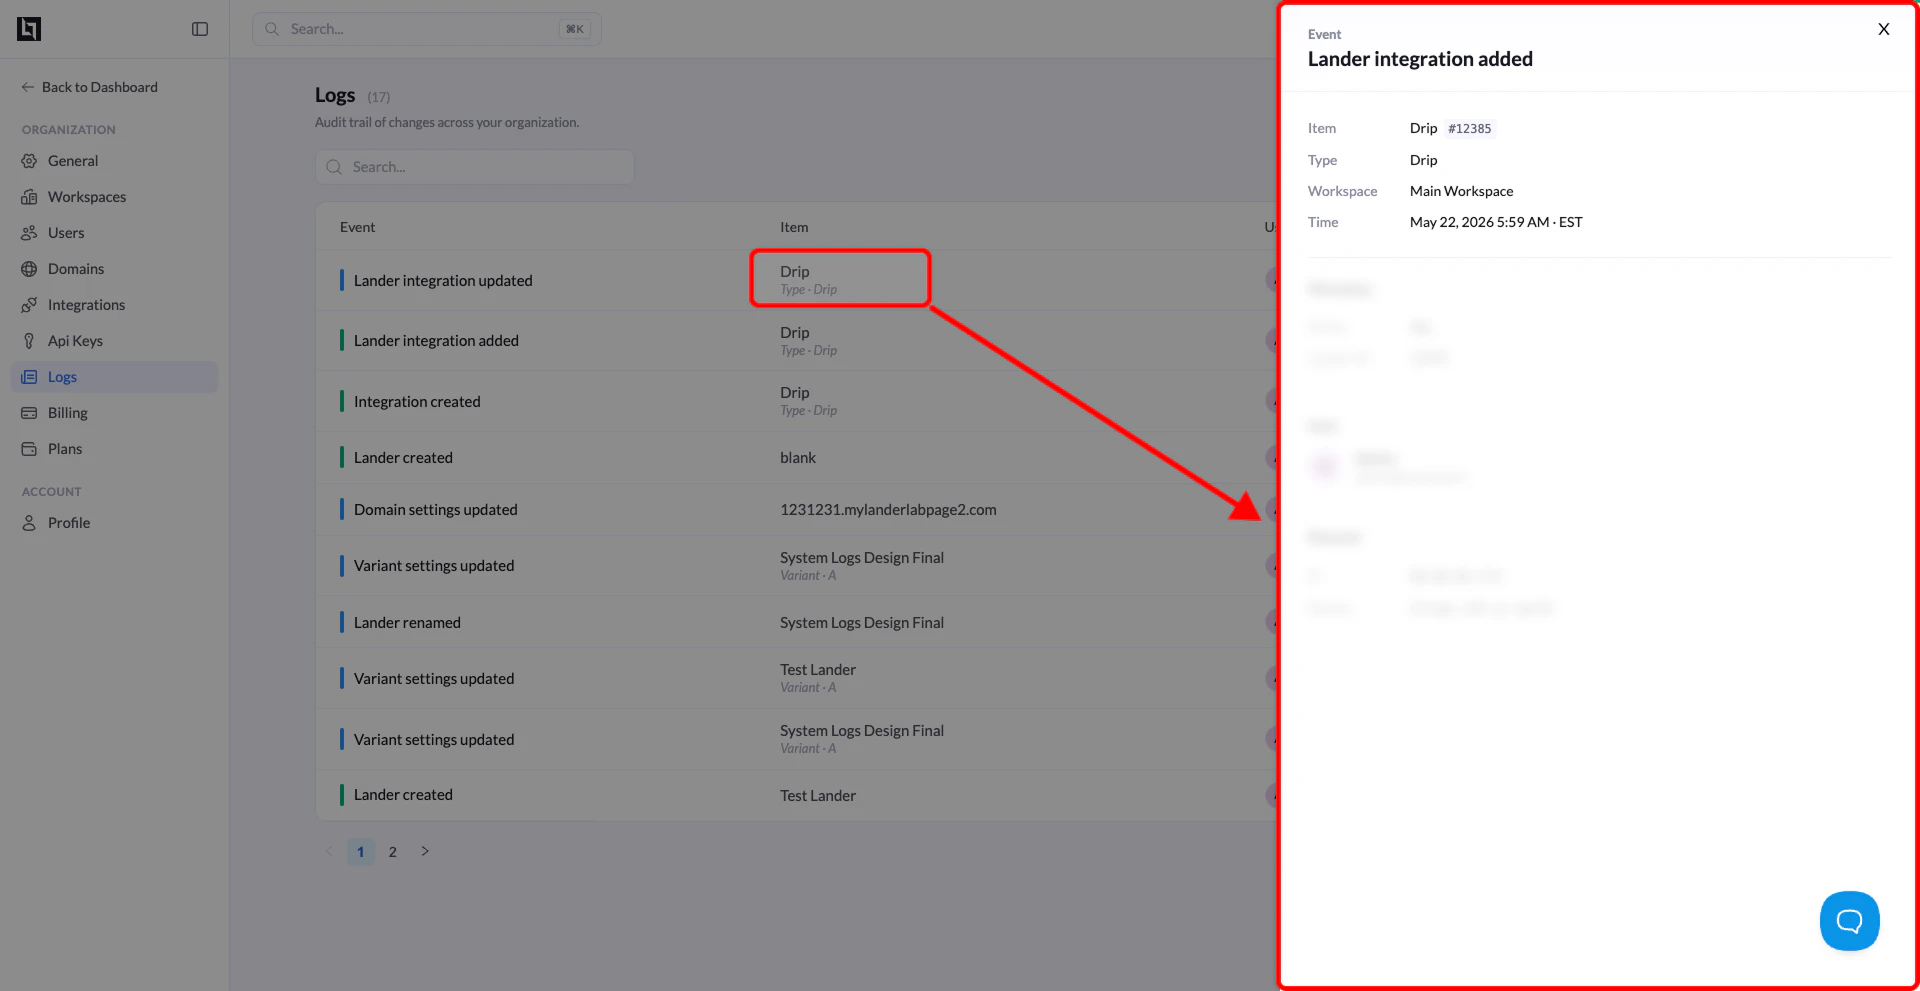
Common Event Types
Below are examples of events you may see in your log:- Lander created
- Lander renamed
- Variant settings updated
- Domain settings updated
- Lander integration added
- Lander integration updated
- Integration created
Logs are read-only. No entries can be edited or deleted. This ensures a reliable audit trail for your organization.