

How to Access Landing Page Analytics
Follow the steps below to view the analytics for a specific landing page.1. Go to Landing Pages
Navigate to your workspace dashboard where your landing pages are listed.2. Select the landing page
Locate the landing page you want to analyze and click its name.3. Open the Overview tab
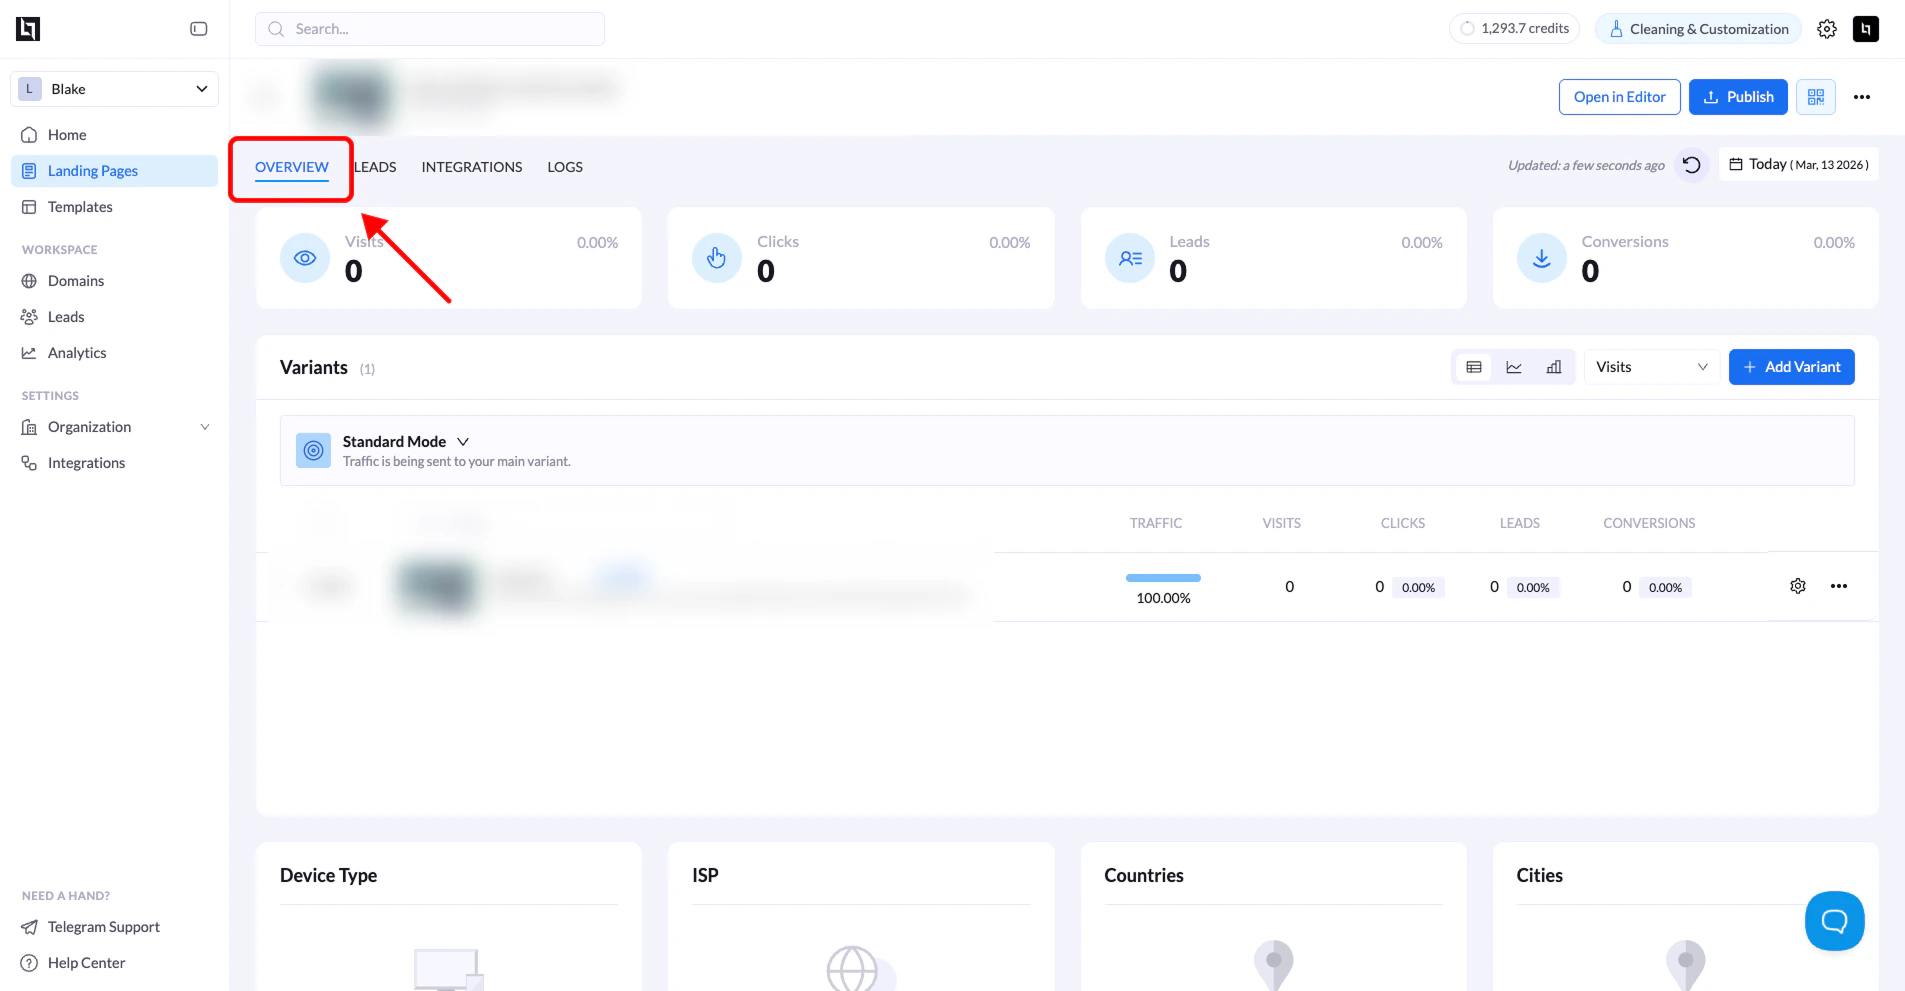
Once the landing page overview opens, make sure you are on the Overview tab.This is where the analytics data is displayed.
4. Select a date range
Click the date range selector in the top-right corner of the page. Choose the time period you want to analyze.5. Analyze the data
After selecting the date range, the analytics dashboard will update and display performance data for the landing page and all of its variants.Key Analytics Metrics
The analytics dashboard includes several important metrics that help you evaluate your landing page performance.| Metric | Description |
|---|---|
| Page Views | Total number of times the landing page has been loaded |
| Clicks | Total number of clicks recorded on the page |
| Leads | Number of leads collected from the page |
| Conversions | Total number of successful conversion events |
Variant Performance
If your landing page has multiple variants (for example during A/B testing), the analytics page shows the performance of each variant individually. You can view:- Traffic percentage assigned to each variant
- Visits
- Clicks
- Leads
- Conversions
Traffic Breakdown
The analytics dashboard also provides additional insights into your traffic sources and audience demographics.Device Breakdown
Shows the distribution of visitors by device type:- Desktop
- Mobile
- Tablet
Geographic Breakdown
Displays where your visitors are coming from, including:- Countries
- Cities