> ## Documentation Index
> Fetch the complete documentation index at: https://docs.landerlab.io/llms.txt
> Use this file to discover all available pages before exploring further.
# View quiz drop-offs
> See how visitors move through each step of your quiz and where they drop off.
If your landing page uses a quiz, LanderLab tracks how visitors move through it step by step. The **drop-off** breakdown shows you exactly where people leave, so you can spot the steps that lose the most visitors and improve them.
You'll find this data on a landing page's **Overview**, under each variant.
## Open the quiz analytics
Go to **Landing Pages** in the left sidebar and open the page whose quiz you want to review.
The **Overview** tab is selected by default. Scroll down to the **Variants** section.
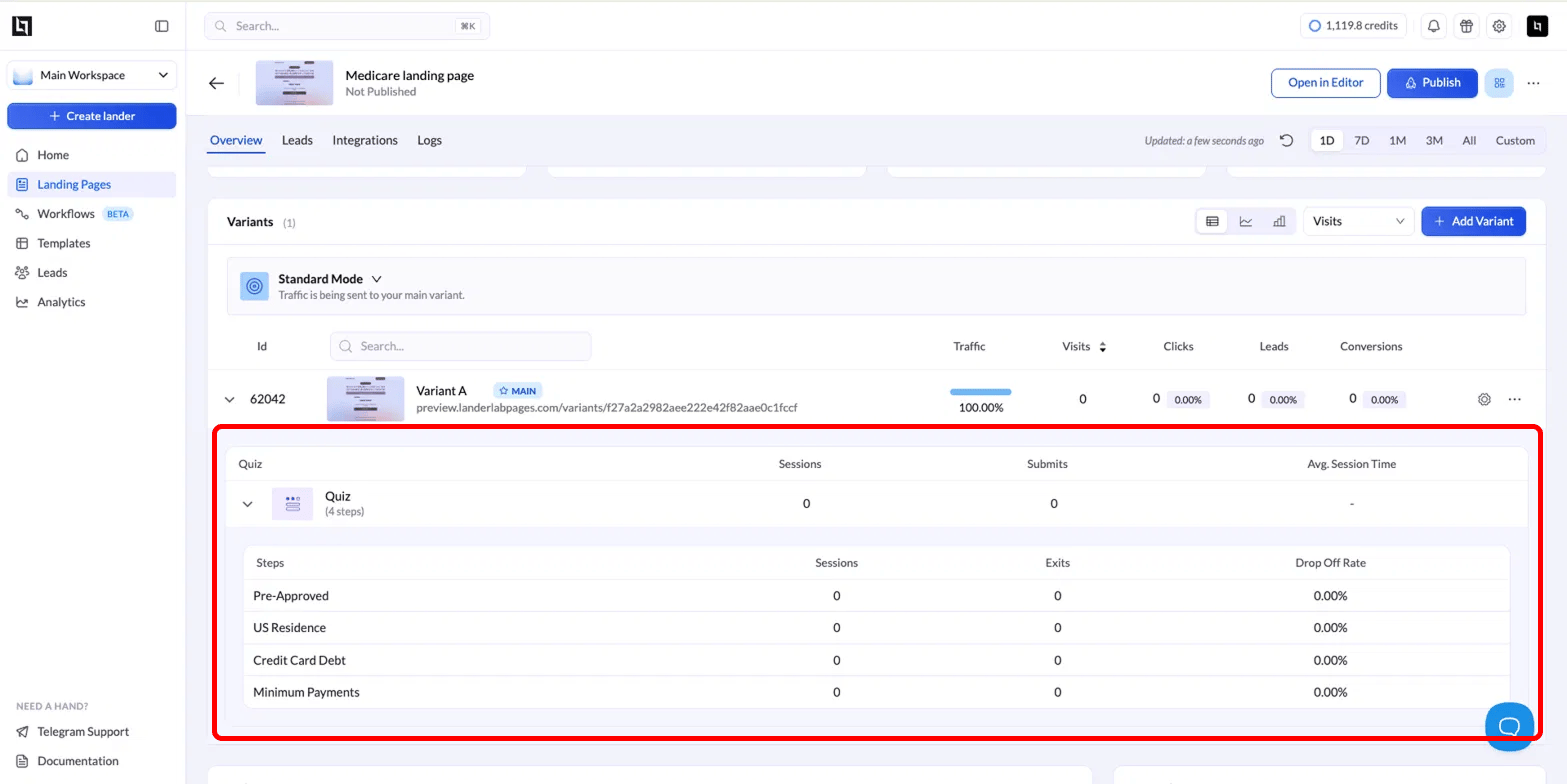
Each variant has a quiz panel beneath it. If your page has one variant, that's the main one (marked **MAIN**); with multiple variants, each has its own quiz stats.
Under the variant, click the **Quiz** row to expand it and reveal the per-step breakdown.
 ## Read the quiz summary
The **Quiz** row gives you the high-level picture for the variant. It also shows how many steps the quiz has (for example, *Quiz (4 steps)*).
| Metric | What it tells you |
| --------------------- | --------------------------------------------------- |
| **Sessions** | How many times the quiz was started. |
| **Submits** | How many visitors completed and submitted the quiz. |
| **Avg. Session Time** | The average time visitors spent in the quiz. |
A large gap between **Sessions** and **Submits** means many people started the quiz but didn't finish — the step table tells you where they left.
## Read the step-by-step drop-offs
Expanding the Quiz panel reveals a row for each step of the quiz, listed in the order visitors see them.
| Column | What it tells you |
| ----------------- | ------------------------------------------------------------------------- |
| **Steps** | The name of each quiz step (for example, *Pre-Approved*, *US Residence*). |
| **Sessions** | How many visitors reached that step. |
| **Exits** | How many visitors left on that step instead of continuing. |
| **Drop Off Rate** | The share of that step's sessions that exited there. |
Read the table top to bottom to follow the funnel. The step with the highest **Drop Off Rate** is where you're losing the most visitors — a good place to start when improving the quiz.
A step with a high drop-off rate often signals friction: a confusing question, a step that asks for too much, or a point where visitors lose interest. Try simplifying or reordering that step and compare the rates again.
## Change the date range
Use the range selector at the top right of the Overview — **1D**, **7D**, **1M**, **3M**, **All**, or **Custom** — to scope the quiz numbers to a specific period. The figures update to match the selected range.
Quiz data appears only for landing pages that include a quiz, and the numbers populate as visitors interact with the page. A page with no traffic yet shows zeros across every step.
## Read the quiz summary
The **Quiz** row gives you the high-level picture for the variant. It also shows how many steps the quiz has (for example, *Quiz (4 steps)*).
| Metric | What it tells you |
| --------------------- | --------------------------------------------------- |
| **Sessions** | How many times the quiz was started. |
| **Submits** | How many visitors completed and submitted the quiz. |
| **Avg. Session Time** | The average time visitors spent in the quiz. |
A large gap between **Sessions** and **Submits** means many people started the quiz but didn't finish — the step table tells you where they left.
## Read the step-by-step drop-offs
Expanding the Quiz panel reveals a row for each step of the quiz, listed in the order visitors see them.
| Column | What it tells you |
| ----------------- | ------------------------------------------------------------------------- |
| **Steps** | The name of each quiz step (for example, *Pre-Approved*, *US Residence*). |
| **Sessions** | How many visitors reached that step. |
| **Exits** | How many visitors left on that step instead of continuing. |
| **Drop Off Rate** | The share of that step's sessions that exited there. |
Read the table top to bottom to follow the funnel. The step with the highest **Drop Off Rate** is where you're losing the most visitors — a good place to start when improving the quiz.
A step with a high drop-off rate often signals friction: a confusing question, a step that asks for too much, or a point where visitors lose interest. Try simplifying or reordering that step and compare the rates again.
## Change the date range
Use the range selector at the top right of the Overview — **1D**, **7D**, **1M**, **3M**, **All**, or **Custom** — to scope the quiz numbers to a specific period. The figures update to match the selected range.
Quiz data appears only for landing pages that include a quiz, and the numbers populate as visitors interact with the page. A page with no traffic yet shows zeros across every step.