> ## Documentation Index
> Fetch the complete documentation index at: https://docs.landerlab.io/llms.txt
> Use this file to discover all available pages before exploring further.
# System Activity Logs
> Track every change made across your organization with the audit log. Filter by user, category, or date range and drill into full event details.
## Where to Find Logs
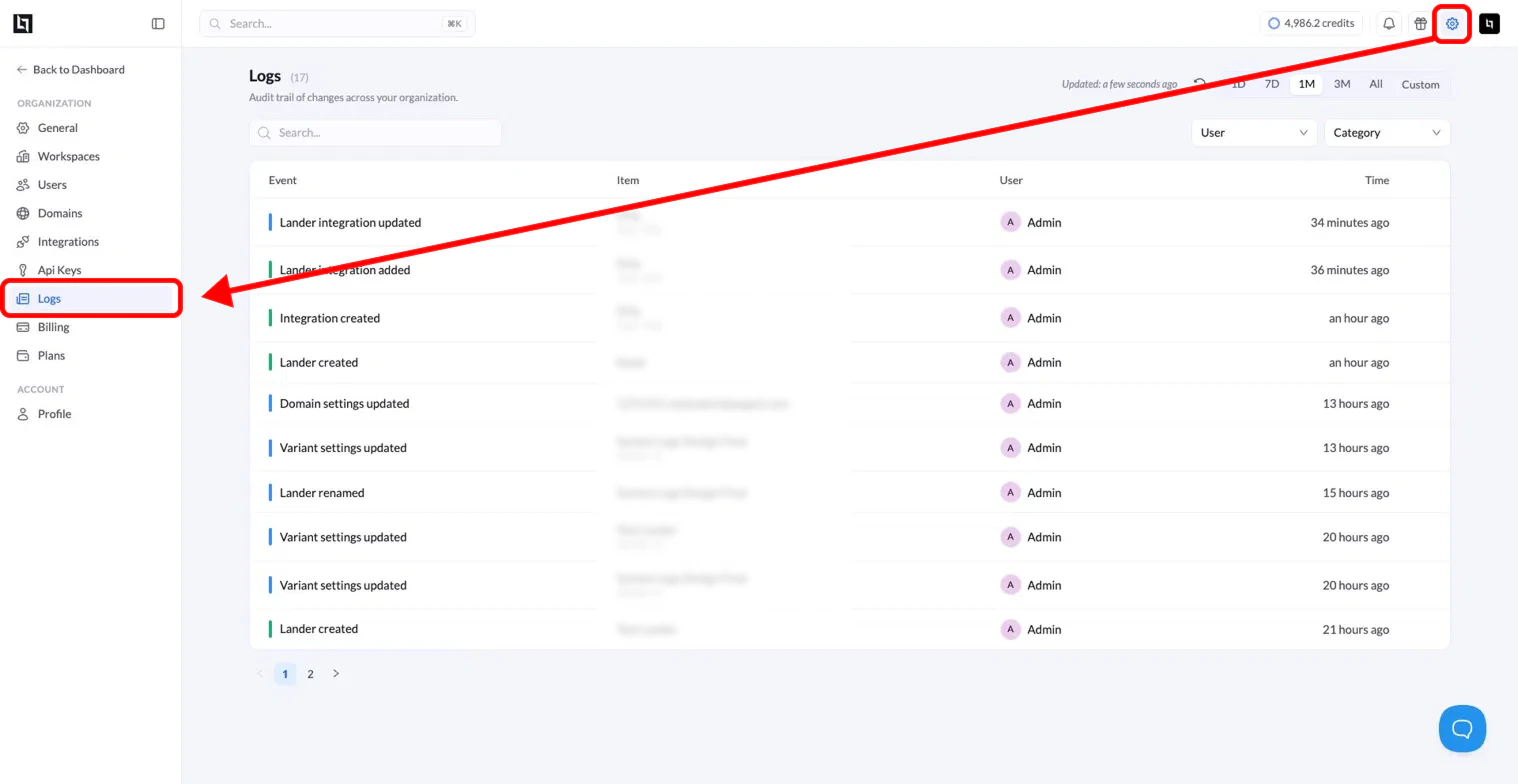
Go to **Settings** and click **Logs** in the left sidebar. The page displays all events across your organization in reverse chronological order.
 ## Reading the Log Table
Each row in the log table represents a single event and shows four columns:
| Column | Description |
| :-------- | :-------------------------------------------------------------------------------------------------- |
| **Event** | The type of action that was performed (for example, "Lander created" or "Variant settings updated") |
| **Item** | The specific lander, integration, domain, or other item that was affected |
| **User** | The team member who performed the action |
| **Time** | How long ago the event occurred |
A colored bar on the left edge of each row provides a quick visual indicator for the event type.
## Filtering Logs
You can narrow the log view using the controls at the top of the page:
* **Date range**: Choose from **1D**, **7D**, **1M**, **3M**, **All**, or **Custom** to limit results to a specific time window.
* **User**: Filter by a specific team member to see only their activity.
* **Category**: Filter by event category to focus on a particular type of action.
* **Search**: Use the search bar to find events by keyword.
## Viewing Event Details
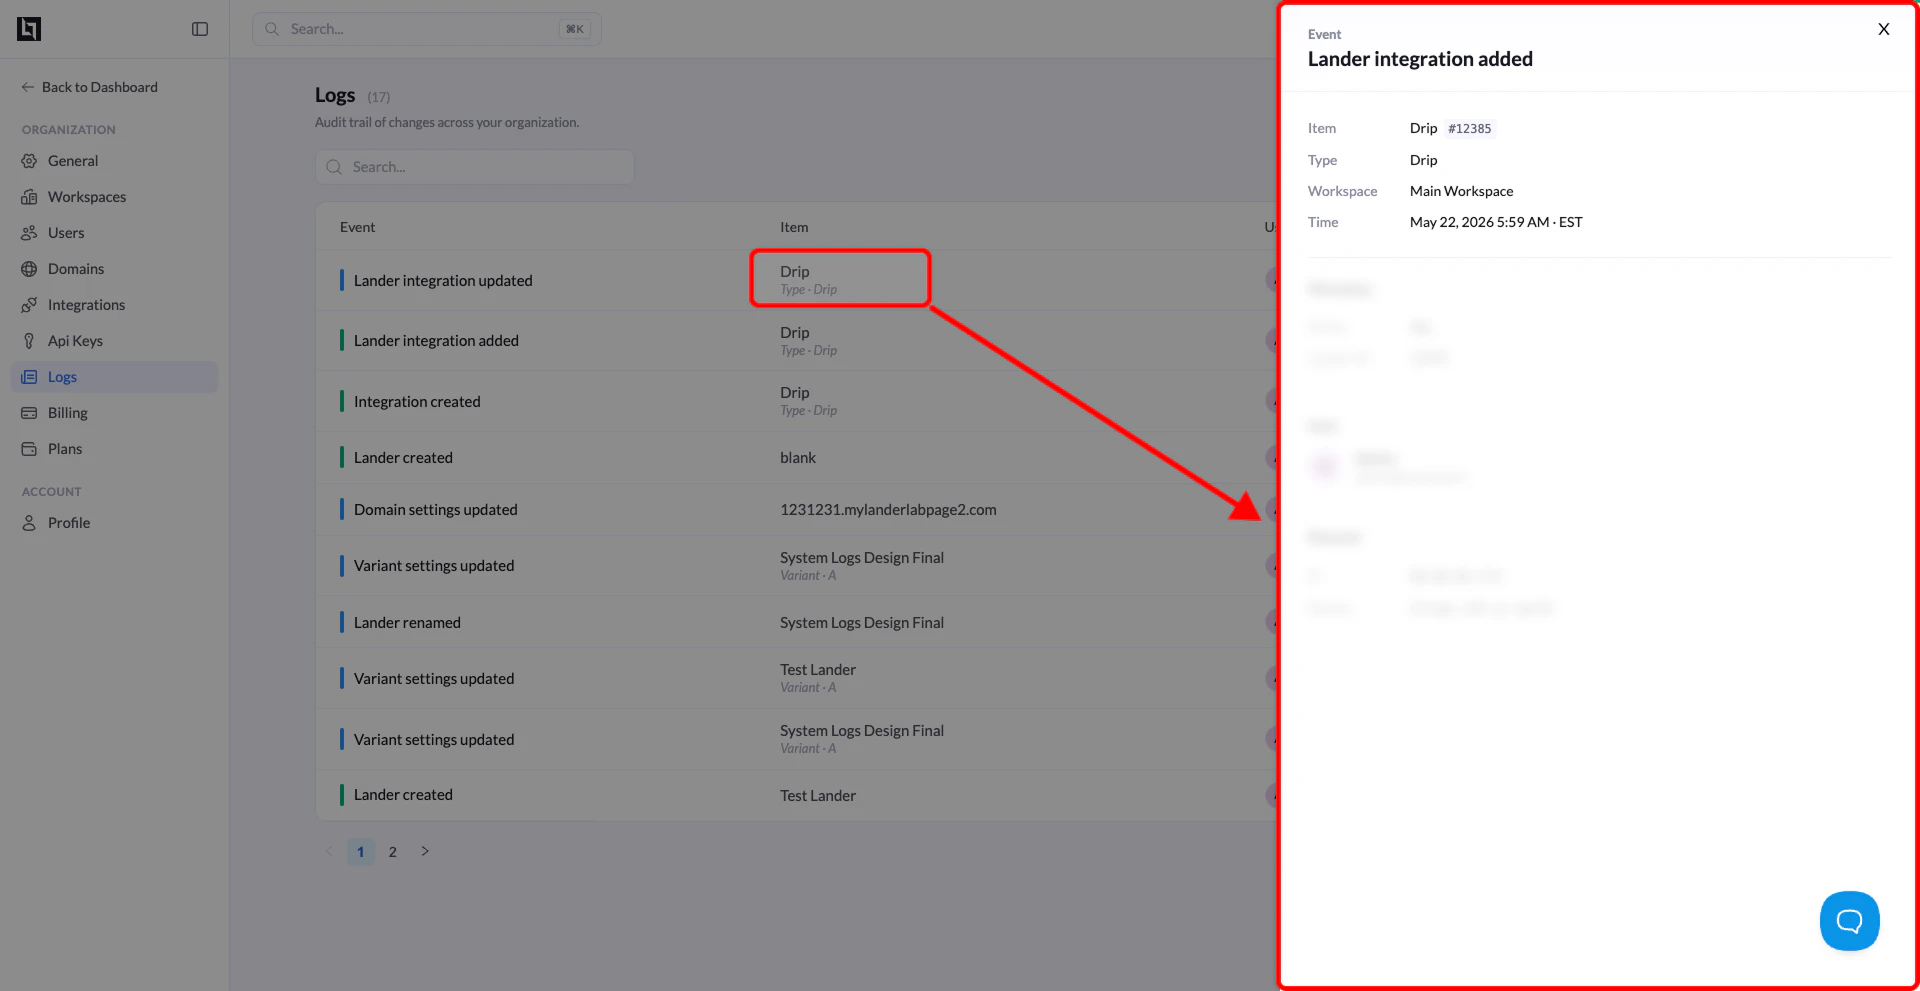
Click any row to open the event detail panel. This panel shows a full breakdown of the event:
## Reading the Log Table
Each row in the log table represents a single event and shows four columns:
| Column | Description |
| :-------- | :-------------------------------------------------------------------------------------------------- |
| **Event** | The type of action that was performed (for example, "Lander created" or "Variant settings updated") |
| **Item** | The specific lander, integration, domain, or other item that was affected |
| **User** | The team member who performed the action |
| **Time** | How long ago the event occurred |
A colored bar on the left edge of each row provides a quick visual indicator for the event type.
## Filtering Logs
You can narrow the log view using the controls at the top of the page:
* **Date range**: Choose from **1D**, **7D**, **1M**, **3M**, **All**, or **Custom** to limit results to a specific time window.
* **User**: Filter by a specific team member to see only their activity.
* **Category**: Filter by event category to focus on a particular type of action.
* **Search**: Use the search bar to find events by keyword.
## Viewing Event Details
Click any row to open the event detail panel. This panel shows a full breakdown of the event:
 | Field | Description |
| :------------ | :-------------------------------------------------------------- |
| **Item** | The name and ID of the affected item |
| **Variant** | The variant involved, if applicable |
| **Workspace** | The workspace where the change was made |
| **Time** | The exact date, time, and timezone of the event |
| **Changes** | A summary of what was modified |
| **User** | The name and email address of the person who made the change |
| **IP** | The IP address of the request |
| **Device** | The browser and operating system used at the time of the action |
## Common Event Types
Below are examples of events you may see in your log:
* Lander created
* Lander renamed
* Variant settings updated
* Domain settings updated
* Lander integration added
* Lander integration updated
* Integration created
Logs are read-only. No entries can be edited or deleted. This ensures a reliable audit trail for your organization.
| Field | Description |
| :------------ | :-------------------------------------------------------------- |
| **Item** | The name and ID of the affected item |
| **Variant** | The variant involved, if applicable |
| **Workspace** | The workspace where the change was made |
| **Time** | The exact date, time, and timezone of the event |
| **Changes** | A summary of what was modified |
| **User** | The name and email address of the person who made the change |
| **IP** | The IP address of the request |
| **Device** | The browser and operating system used at the time of the action |
## Common Event Types
Below are examples of events you may see in your log:
* Lander created
* Lander renamed
* Variant settings updated
* Domain settings updated
* Lander integration added
* Lander integration updated
* Integration created
Logs are read-only. No entries can be edited or deleted. This ensures a reliable audit trail for your organization.