> ## Documentation Index
> Fetch the complete documentation index at: https://docs.landerlab.io/llms.txt
> Use this file to discover all available pages before exploring further.
# Reporting Dashboard for Campaign Performance
> Use reporting to compare landing page performance, track conversions, and identify top-performing campaigns across workspaces.
The **Reporting** section provides a centralized overview of the performance of all your landing pages across your workspaces. This unified view allows you to quickly compare campaigns and identify which pages are performing best.
By analyzing the reporting dashboard, you can easily monitor key metrics and optimize your marketing efforts.
***
## How to Access Reporting
 Follow these steps to access the reporting dashboard.
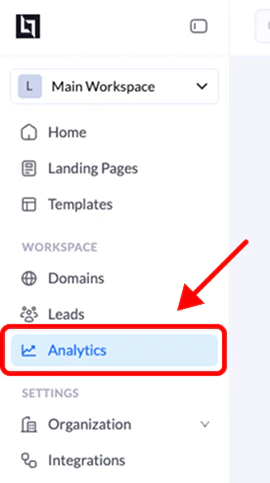
### 1. Open the Reporting section
From your **LanderLab dashboard**, locate the **Reporting** option in the main sidebar navigation and click it.
### 2. View landing page performance
The **Reporting page** will display a table listing all your published landing pages.
Each row contains performance data for a specific landing page.
### 3. Compare campaign results
You can compare the performance of multiple landing pages side by side.
Use the available **sorting or filtering options** in the table header to analyze your campaigns more easily.
For example, you can sort by **Conversion Rate** to quickly find your best-performing pages.
***
## Key Metrics Available
The reporting table displays essential performance metrics for each landing page.
| Metric | Description |
| :----------------------- | :-------------------------------------------------------------- |
| **Visits / Clicks** | Total number of visitors or clicks received by the landing page |
| **Leads / Conversions** | Total number of leads or conversions generated |
| **Conversion Rate (CR)** | Percentage of visitors who completed a conversion action |
***
## Why Use Reporting
The reporting dashboard helps you:
* Quickly identify **top-performing landing pages**
* Compare **multiple campaigns**
* Track **conversion performance across workspaces**
* Identify pages that may require **optimization**
Follow these steps to access the reporting dashboard.
### 1. Open the Reporting section
From your **LanderLab dashboard**, locate the **Reporting** option in the main sidebar navigation and click it.
### 2. View landing page performance
The **Reporting page** will display a table listing all your published landing pages.
Each row contains performance data for a specific landing page.
### 3. Compare campaign results
You can compare the performance of multiple landing pages side by side.
Use the available **sorting or filtering options** in the table header to analyze your campaigns more easily.
For example, you can sort by **Conversion Rate** to quickly find your best-performing pages.
***
## Key Metrics Available
The reporting table displays essential performance metrics for each landing page.
| Metric | Description |
| :----------------------- | :-------------------------------------------------------------- |
| **Visits / Clicks** | Total number of visitors or clicks received by the landing page |
| **Leads / Conversions** | Total number of leads or conversions generated |
| **Conversion Rate (CR)** | Percentage of visitors who completed a conversion action |
***
## Why Use Reporting
The reporting dashboard helps you:
* Quickly identify **top-performing landing pages**
* Compare **multiple campaigns**
* Track **conversion performance across workspaces**
* Identify pages that may require **optimization**